|
|
This blog is part of unitarium.com site where you can find
unit converters, calculators and other information focused on units of measurement. See menu on the left.
October 23rd, 2015
Hurricane Patricia the most intense tropical cyclone ever observed in the Western Hemisphere is comming.
With measured winds speed of 200 MPH (322 km/h)
Hurricane Patricia became the strongest tropical cyclone ever recorded.
The minimum barometric pressure is
880 hPa (25.99 inHg, 660 mmHg),
and the hurricane is moving north-northwest,
speed – 10mph (9.7 knots, 16 km/h)
Storms with an intensity of 922 hPa (27.23 inHg) or less for only Eastern Pacific Ocean are listed below.
Source: East Pacific Hurricane Best Track File 1851–2014
| Cyclone |
Year |
Max. Speed |
Min. Pressure |
| Ava |
1973 |
260 km/h (160 mph) |
915 hPa (27.02 inHg) |
| Gilma |
1994 |
260 km/h (160 mph) |
920 hPa (27.17 inHg) |
| Guillermo |
1997 |
260 km/h (160 mph) |
919 hPa (27.14 inHg) |
| Linda |
1997 |
295 km/h (185 mph) |
902 hPa (26.64 inHg) |
| Elida |
2002 |
260 km/h (160 mph) |
921 hPa (27.20 inHg) |
| Hernan |
2002 |
260 km/h (160 mph) |
921 hPa (27.20 inHg) |
| Kenna |
2002 |
270 km/h (165 mph) |
913 hPa (26.96 inHg) |
| Ioke |
2006 |
260 km/h (160 mph) |
915 hPa (27.02 inHg) |
| Rick |
2009 |
285 km/h (180 mph) |
906 hPa (26.75 inHg) |
| Celia |
2010 |
260 km/h (160 mph) |
921 hPa (27.20 inHg) |
| Marie |
2014 |
260 km/h (160 mph) |
918 hPa (27.11 inHg) |
| Odile |
2014 |
220 km/h (140 mph) |
918 hPa (27.11 inHg) |
| Patricia |
2015 |
325 km/h (200 mph) |
880 hPa (25.99 inHg) |
Tags: hurricane, speed, storm
Posted in Articles | Comments Off on Hurricane Patricia Speed
June 17th, 2013
The next full moon falls on June 23, 2013 at 11:32 UTC. (US time zones: 4:32 am PDT, 5:32 a.m. MDT, 6:32 a.m. CDT, 7:32 a.m. for other time zones you can click the link to convert 11:32 UTC to your local time and date). This full moon will be called supermoon or super full moon or perigee full moon because of the closest approach of the full moon to the Earth for all of 2013. Supermoon could be up to 30% brighter and 14% larger then at its apogee furthest point.
See also: Moon Phase Tonight – current (or at any time) Moon’s phase and position, parameters, such as illumination, elongation, distance to the Earth, …
Table below lists supermoon dates between 2010 and 2016. As you can see on May 6, 2012 super full moon was ‘extremely super’. There was only 2 minutes difference between perigee and full moon.
| Year |
Super Full Moon |
Perigee |
Difference |
| Date UTC |
Dist. [km] |
Date UTC |
Dist. [km] |
Time |
Dist. [km] |
| 2010 |
Jan 30 6:19 |
356607.267 |
Jan 30 9:04 |
356593.813 |
2h 45m |
13.454 |
| 2011 |
Mar 19 18:11 |
356579.792 |
Mar 19 19:10 |
356578.229 |
0h 59m |
1.563 |
| 2012 |
May 6 3:36 |
356954.016 |
May 6 3:34 |
356954.015 |
0h 2m |
0.01 |
| 2013 |
Jun 23 11:32 |
356991.415 |
Jun 23 11:11 |
356991.226 |
0h 21m |
0.189 |
| 2014 |
Aug 10 18:11 |
356898.198 |
Aug 10 17:44 |
356897.888 |
0h 27m |
0.310 |
| 2015 |
Sep 28 2:52 |
356878.329 |
Sep 28 1:47 |
356876.424 |
1h 5m |
1.905 |
| 2016 |
Nov 14 13:54 |
356522.757 |
Nov 14 11:24 |
356511.782 |
2h 30m |
10.975 |
Tags: moon, supermoon
Posted in Articles | Comments Off on Supermoon Dates
May 24th, 2013
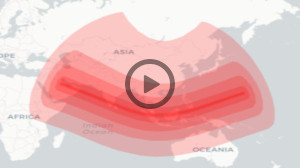
A penumbral lunar eclipse will take place on May 25, 2013.
Where the Moon eclipse will be visible?
Figure below shows the Earth’s area where the Moon eclipse will be visible (source: eclipse.gsfc.nasa.gov)

Click the image to enlarge. The eclipse will be visible in the white area, so as you can see, the eclipse will be visible from the Americas and western Africa.
What time will 25 May, 2013 Moon eclipse will take place?
Note: you can click on the links to see the UTC hours in your local time.
See also: Moon Phase Tonight Current or simulated Moon phase, position and Moon parameters such as Moon-Earth distance, illumination, declination etc.
Tags: eclipse, moon
Posted in Articles | Comments Off on Moon Eclipse 25 May 2013
July 5th, 2012
Today two new pages have been added to our site.
- London 2012 – Current Time – current time during XXX Summer Olympic Games in London 2012, ‘uk time to my time’ conversion chart, time differences between user local time and BST (British Summer Time – time observed in London during Olympic Games), most interesting sport events (finals and gold medal matches) schedule with time given in BST, UTC and user local time, map of venues.
- London 2012 – List of Venues – list of all Olympic Venues with sports, location, zone, capacity. Map of Olympic Venues.
Tags: london 2012, sport, time
Posted in News & Info | Comments Off on LONDON 2012 – Two New Pages
July 4th, 2012
In Wimbledon’s quarterfinals:
Agnieszka Radwanska (POL) defeated Maria Kirilenko (RUS) 7 – 5, 4 – 6, 7 – 5
Serena Williams (USA) defeated Petra Kvitova (CZE) 6-3, 7-5
Angelique Kerber (GER) defeated Sabine Lisicki (GER) 6-3 6-7(7) 7-5
Victoria Azarenka (BLR) Tamira Paszek (AUT) 6-3 7-6(4)
World No 3. Agnieszka Radwanska will face Angelique Kerber (8) in the ladies’ semifinals.
World No 6. Serena Williams will face Victoria Azarenka (2) in the Wimbledon’s semifinal.
Ladies’ semifinals are scheduled to be played Thursday, July 5, 2012 at 12:00 UK time (11:00 UTC)
See also: Current Time At Wimbledon
Tags: sport, tennis, wimbledon
Posted in Articles | Comments Off on Wimbledon 2012 Ladies’ Semifinals
June 28th, 2012
Today (28 July 2012) Italy wins over Germany 2:1 in semi-finals of UEFA European Football Championship EURO 2012. So, Italy will face Spain in the final on Sunday (July 1) in Kiev, Ukraine.
See also: EURO 2012 Time Now
Tags: euro 2012, football, sport
Posted in Articles | Comments Off on EURO 2012 – Italy vs Germany 2:1
June 28th, 2012
On 28 June 2012, Lukas Rosol (27 years old) defeated Rafael Nadal (world number 2 ) at Wimbledon in the second round in five sets (6:7 (9-11), 6:4, 6:4, 2:6, 6:4), to achieve one of the biggest upsets in the tournament’s history. Tim Henman (retired English tennis player) cited his performance as a “freak match”, as it was only his 19th match win ever.
See also: Wimbledon – Current Time
Tags: sport, tennis, wimbledon
Posted in Articles | Comments Off on Lukas Rosol – Wimbledon
June 26th, 2012
The 2012 Wimbledon Tennis Championships take place at the All England Lawn Tennis
and Croquet Club in Wimbledon, London, UK, from 25 June to 8 July 2012.
It is the 126th edition of the championships. It’s part of the Grand Slam and
ATP World Tour.
On our newly launched page you can easily check current time in Wimbledon, London, UK as well as time difference between your local time and British Summer Time.
Tags: sport, tennis, wimbledon
Posted in News & Info | Comments Off on Wimbledon 2012
June 5th, 2012
The final tournament of the UEFA European Football Championship EURO 2012 starts on Friday, June 8 2012. It will be hosted by Poland and Ukraine between 8 June and 1 July 2012. Because it is one of the greatest events in European Football (soccer), for those who want to follow the matches, we provide a special page:UEFA EURO 2012 match schedule and time now in Poland and Ukraine.
The page includes:
- Current UTC, current user local time, current time in Poland and Ukraine.
- Timetable of the EURO 2012 matches with time given in
UTC, Poland (CEST-Central European Summer Time), Ukraine (EEST-Estern European Summer Time)
and, probably most important – user local time. (It also includes
printable version of the EURO 2012 schedule)
- Timezone difference between Poland, Ukraine and user local time.
- Locations of Stadiums in Poland and Ukraine (google maps)
All matches during EURO 2012 are scheduled to be played at 16:00 (4:00pm) and 18:45 (6:45pm) UTC; 18:00 (6:00pm), 20:45 (8:45pm) Poland/CEST; 19:00 (7:00pm), 21:45 (9:45pm) Ukraine/EEST. Using the page, you can easily check kick-off times of the matches in your local time.
Tags: euro 2012, football, soccer, sport, time, timezone
Posted in News & Info | Comments Off on UEFA EURO 2012 Final Tournament
September 25th, 2011
Patrick Makau from Kenya brakes men’s marathon world record on Sunday, 25 september 2011 and wins Berlin marathon. He ran 42 km and 195 meters (26.2188 miles) in 2 hours 3 minutes 38 seconds. The previous record was set by Haile Gebrselassie (Ethiopia) in 2008 on the same Berlin course.
Patrick Makau average speed during his winning marathon race in Berlin was: 42.195m/2h3m38s = 20.48km/h or 12.72 miles/hour (as you can compute in our speed calculator)
Tags: marathon, sport
Posted in Articles | Comments Off on Patrick Makau Record
|