|
|
This blog is part of unitarium.com site where you can find
unit converters, calculators and other information focused on units of measurement. See menu on the left.
June 21st, 2010
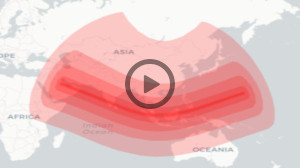
I recently made, interesting I hope, visualisation of the situation in FIFA 2010 World Cup’s Group A before last phase of the group stage. Does France has chance to be qualified and go out the group stage? Does South Africa has any chance of advancing? Let’s see:

The drawing above comes from: Group A. Who will be qualified?
Each square of the drawing represents different result of the both last matches in group A (Uruguay vs. Mexico and France vs. South Africa). Colors tell us who will be qualified to the next round. White – Uruguay and Mexico, Black – Uruguay and France, red – Uruguay and South Africa, blue France and Mexico, yellow – Mexico and S.Africa. As you can see, there is a lot of white squares (that means Uruguay and Mexico will be qualified), blue and black (France will be qualified) squares are on the left. Theoreticaly, they ‘starts’ at 1:0 for France but in the last row (that means Uruguay have to win 4:0 for France to go out the qroup)
There’s no blue and black squares on the right. It means France have to win their last match and … hope for good Uruguay – Mexico result. No tied score in the other match will promote France to the next round (middle rows are white, every tied match promotes Uruguay and Mexico). The only chance for France is to make huge win to South Africa and hope for big luck (no tied and, the best for them – big difference of goals in Uruguay vs. Mexico match – no matter who wins)
I personaly think France will not be qualified and they do not go out the group stage of 2010 World Cup, but … we will see tomorow. When does France vs. South Africa match starts? The match will be played June 22,2010 at 16:00 (South Africa Time Zone UTC+2) in Bloemfontein.
See also: MUNDIAL match results, 2010 FIFA Schedule
Tags: mundial, sport
Posted in Other | Comments Off on France’s chances to go out the group
June 20th, 2010
Yesterday printable version of FIFA World Cup match schedule has beed added to unitarium site and today we made printable version of FIFA World Cup Group Stage – Current Rankings and Results. It lists all mundial groups with their current team ranking and the results of finished matches. The page will be updated when next matches will be finished.
Group Stage of 2010 FIFA World Cup started June 11, 2010 and is supposed to be finished on June 25, 2010.
The teams placed first and second (shaded in green) qualified to the round of 16. For the World Cup tournament, FIFA uses the following criteria to rank teams in the Group Stage.
1.greatest number of points in all group matches;
2.goal difference in all group matches;
3.greatest number of goals scored in all group matches;
4.greatest number of points in matches between tied teams;
5.goal difference in matches between tied teams;
6.greatest number of goals scored in matches between tied teams;
7.drawing of lots by the FIFA Organising Committee.
You can easily change font (e.g. Arial, Verdana, Courier, … ) and choose the background to be printed or not. Note, font changing could change a little the size of the printed page.
Posted in News & Info | Comments Off on FIFA Current Group Ranking And Results To Print
June 19th, 2010
Couple of days ago we added to our site FIFA World Cup Match Schedule (calendar of all FIFA 2010 WCup matches with dates, places and results of the finished matches). Today, printable version of this calendar has been added to our site. It is here:
The schedule includes group stage, round of 16, quarter-finals, semi-finals and both final matches. It lists teams, day, month, time of the match, result (if the match is finished already) and the city where the match is played.
You can easily change printing font (e.g. Arial, Verdana, Courier, … ) and choose to print or not the background. Note, font changing could change a little the size of the calendar.
Tags: mundial
Posted in Other | Comments Off on Printable Version Of FIFA World Cup Match Schedule
June 18th, 2010
We celebrate soccer World Cup. Two pages have been added to our service.
FIFA World Cup in South Africa starts july 11. Match for the third place is scheduled on July 10 at 20:30 (South Africa time – UTC+2) and the final match will be played on July 11 (South Africa time – UTC+2) played july 11.
Tags: mundial
Posted in Other | Comments Off on FIFA World Cup 2010 (MUNDIAL 2010)
February 13th, 2010
Simon Ammann won the gold Olympic Medal on HS106 ski jumping hill in Vancouver. He jumped 108m (118.1yd, 354.3ft). This is new hill record. Previous was set by Guido Landert and it was 105 meters (344.49ft)
1. Simon Ammann Swiss 105m (344.49ft) 135.5 108m (354.3ft) 141 276.50
2. Adam Małysz Poland 103.5m (339.57ft) 132.5 105m (344.49ft) 137 269.50
3. Gregor Schlierenzauer Austria 101.5m (333.01ft)128 106.5m (349.41) 140 268.00
Tags: length, ski, vancouver 2010
Posted in Articles | Comments Off on Simon Ammann 108m
February 9th, 2010
The tables below lists Vancouver sports events distances in kilometers, meters, miles, yards and feet. Click the link to go to length converter online and get more conversion units.
Vancouver Men’s Sports Distances Conversion Table
| Event |
Kilometers |
Meters |
Miles |
Yards |
Feet |
| Biathlon |
| Relay |
4×7.5km |
4×7,500 |
4×4.66 |
4×8,202 |
4×24,606 |
| Sprint |
10km |
10,000 |
6.21 |
10,936 |
32,808 |
| Pursuit |
12.5km |
12,500 |
7.77 |
13,670 |
41,010 |
| Mass Start |
15km |
15,000 |
9.32 |
16,404 |
49,212 |
| Individual |
20km |
20,000 |
12.43 |
21,872 |
65,617 |
| Cross-country skiing |
| Freestyle |
15km |
15,000 |
9.32 |
16,404 |
49,212 |
| Pursuit |
30km |
30,000 |
18.64 |
32,808 |
98,425 |
| Classical |
50km |
50,000 |
31.07 |
54,681 |
164,042 |
| Relay |
4x10km |
4×10,000 |
4×6.21 |
4×10,936 |
4×32,808 |
| Short Track |
|
0.5km |
500 |
0.31 |
547 |
1,640 |
|
1km |
1,000 |
0.62 |
1,094 |
3,281 |
|
1.5km |
1,500 |
0.93 |
1,640 |
4,921 |
|
5km |
5,000 |
3.11 |
5,468 |
16,404 |
| Speed Skating |
|
0.5km |
500 |
0.31 |
547 |
1,640 |
|
1km |
1,000 |
0.62 |
1,094 |
3,281 |
|
1.5km |
1,500 |
0.93 |
1,640 |
4,921 |
|
5km |
5,000 |
3.11 |
5,468 |
16,404 |
|
10km |
10,000 |
6.21 |
10,936 |
32,808 |
Vancouver Womens’s Sports Distances Conversion Table
| Event |
Kilometers |
Meters |
Miles |
Yards |
Feet |
| Biathlon |
| Relay |
4×6 km |
4×6000 |
4×3.73 |
4×6,562 |
4×19,685 |
| Sprint |
7.5 km |
7,500 |
4.66 |
8,202 |
24,606 |
| Pursuit |
10 km |
10,000 |
6.21 |
10,936 |
32,808 |
| Mass Start |
12.5 km |
12,500 |
7.77 |
13,670 |
41,010 |
| Individual |
15 km |
15,000 |
9.32 |
16,404 |
49,212 |
| Cross-country skiing |
| Freestyle |
10 km |
10,000 |
6.21 |
10,936 |
32,808 |
| Pursuit |
15 km |
15,000 |
9.32 |
16,404 |
49,212 |
| Classical |
30 km |
30,000 |
18.64 |
32,808 |
98,425 |
| Relay |
4×5 km |
4×5,000 |
4×3.11 |
4×5,468 |
4×16,404 |
| Short Track |
|
0.5 km |
500 |
0.31 |
547 |
1,640 |
|
1 km |
1,000 |
0.62 |
1,094 |
3,281 |
|
1.5 km |
1,500 |
0.93 |
1,640 |
4,921 |
|
3 km |
3,000 |
1.86 |
3281 |
9843 |
| Speed Skating |
|
0.5 km |
500 |
0.31 |
547 |
1,640 |
|
1 km |
1,000 |
0.62 |
1,094 |
3,281 |
|
1.5 km |
1,500 |
0.93 |
1,640 |
4,921 |
|
3 km |
3,000 |
1.86 |
3281 |
9843 |
|
5 km |
5,000 |
3.11 |
5,468 |
16,404 |
Tools: Distance Conversion Online
Tags: length, sport, vancouver 2010
Posted in Articles | Comments Off on Vancouver Sports Events Distances
February 8th, 2010
There are two ski jumping hills in the Vancouver’s Whistler Olympic Park – Large Hill (LH HS140/K125) and Normal Hill (NH HS106/K95). Technical data and the hill records (given in meters and feet) are available in the tables below.
| Whistler Olympic Large Hill HS140 (K125) |
| Hill Record |
149.0m (488.85ft)
Gregor Schlierenzauer 2009-01-25 |
| Hill Size |
140m (459.32ft) |
| K-point |
125m (410.1ft) |
| Takeoff gradient |
11.25° |
| Landing gradient |
35.0° |
| Construction year |
2007 |
| Spectator capacity |
10,000 |
| Whistler Olympic Normal Hill HS106 (K95) |
| Hill Record |
105.0m (344.49ft)
Guido Landert 2008-02-28 |
| Hill Size |
106m (347.77ft) |
| K-point |
95m (311.68ft) |
| Takeoff gradient |
11.0° |
| Landing gradient |
34.0° |
| Construction year |
2007 |
| Spectator capacity |
10,000 |
Source: fisskijumping.com
HillSize (HS) – distance between take-off and landing field where the gradient is equal to 32.5° (see: L-point on the image below)
K-point (calculation line or calculation point) – Skiers are awarded 60 points if they land on the K Line. Skiers not landing on the K Line receive or lose points for every metre (3 ft) they miss the mark by, depending on if they surpass it or fall short, respectively. The value of a meter is determined from the size of the hill.
How K-point and HillSize are calculated, see the image below
(source: Whistler 140 Profile)

Useful tools: Length Converter
Tags: length, ski, sport, vancouver 2010
Posted in Articles | Comments Off on Vancouver Ski Jumping Hills
February 8th, 2010
It should be obvious that the maximum and average speed in downhill skiing strongly depends on the course racer runs on. On a typical FIS-approved, international-level course racers can run about 130 km/h (80mph) but some courses can be faster. For example, in certain sections of “Streif” course in Kitzbühel, Austria racers can run up to 140 kilometers per hour (87 miles per hour) (Course Start at 1.665m/5462.6ft, finish 805m/2641.08ft, vertical drop 860m/2821.52ft, length 3.312m/10866.14ft, average gradient 27%, maximum gradient 85%, minimum gradient 2%)
Right from the start, racers require a great deal of courage and self-confidence to fully charge the course, launching off to jumps of 50 m to 80 m at the sharp edge into Mausefalle. The Compression following Mausefalle has proved fatal to many a favorite in his struggle to resist the tremendous forces acting on him. (Source: hahnenkamm.com)
Vancouver 2010 downhill men will run February 13th, 2010 on Dave Murray downhill track in Whistler Creek (length 3158m, vertical drop 853m, maximum gradient 47%, average gradient 28% Source:scribd.com )
Speed skiing
Speed skiing is the sport of skiing downhill in a straight line as quickly as possible. It is one of the fastest non-motorized sports on land … The current world record is 251.4 km/h (156 mph), held by Simone Origone. Speed skiers regularly exceed 200 km/h (125 mph), which is even faster than the terminal velocity of a free-falling skydiver; about 193 km/h (120 mph) in the belly-to-earth position
Speed skiing official world records
Men: Simone Origone, Italy – 251.4 km/h (156.2 mph), April 2006 Les Arcs, France
Women: Sanna Tidstrand, Sweden – 242.59 km/h (150.74 mph), April 2006 Les Arcs, France
Useful tools: Speed Converter, Length Converter
Tags: ski, speed, sport, vancouver 2010
Posted in Articles | Comments Off on Downhill skiing speed
February 5th, 2010
| ft in |
inches |
centimeters |
| 5’0” |
60in |
152.40cm |
| 5’1” |
61in |
154.94cm |
| 5’2” |
62in |
157.48cm |
| 5’3” |
63in |
160.02cm |
| 5’4” |
64in |
162.56cm |
| 5’5” |
65in |
165.10cm |
| 5’6” |
66in |
167.74cm |
| 5’7” |
67in |
170.18cm |
| 5’8” |
68in |
172.72cm |
| 5’9” |
69in |
175.26cm |
| 5’10” |
70in |
177.80cm |
| 5’11” |
71in |
180.34cm |
| 6’0” |
72in |
182.88cm |
| 6’1” |
73in |
185.45cm |
| 6’2” |
74in |
187.96cm |
| 6’3” |
75in |
190.50cm |
| 6’4” |
76in |
193.04cm |
| 6’5” |
77in |
195.58cm |
| 6’6” |
78in |
198.12cm |
| 6’7” |
79in |
200.66cm |
| 6’8” |
80in |
203.20cm |
| 6’9” |
81in |
205.74cm |
| 6’10” |
82in |
208.28cm |
| 6’11” |
83in |
210.82cm |
| 7’0” |
84in |
213.36cm |
| 7’1” |
85in |
215.90cm |
| 7’2” |
86in |
218.44cm |
The table allows you to fast and easily convert most common human heights between values given in feet and inches, inches and centimeters. There is no column for hight given in meters because conversion from centimeters to meters is extremely easy (1m is equal to 100cm. To divide number of centimeters by 100, move the decimal point two places to the right, after that value preceding the decimal point will refer to number of meters and two digits after decimal point will refer to number of centimeters. Example: 162.56cm is equal to 1.6256m is equal to a little more then 1 meter and 62cm).
The table lists only most common human heights (more then 95% of adult human population should meet the criteria: higher then 5 inches and shorter then 7ft 2in) but there are some interesting exceptions – the tallest and the shortest. (To make other conversions try height converter)
Tallest People
At 2.57 m (8 ft 5 in), Leonid Stadnyk, of Zhytomyr Oblast, Ukraine, is believed to be the world’s tallest living man, although his height is disputed because of his refusal to be measured. The current proven tallest man is Sultan Kosen of Turkey who stands at 2.47 m (8 ft 1 in), overtaking previous world record holder Bao Xishun of Inner Mongolia, China at 2.36 m (7 ft 9 in) (interestingly, He Pingping, the shortest man in the world, is also from Inner Mongolia). The tallest man in modern history was Robert Pershing Wadlow from Illinois in the United States, who was born in 1918 and stood 2.72 m (8 ft 11 in) at the time of his death in 1940. Until her death in 2008, Sandy Allen was the tallest woman in the world at 2.32 m (7 ft 7+1⁄2 in). Currently Yao Defen of China is claimed to be the tallest woman in the world at 2.33 m (7 ft 7+1⁄2 in), but this is not confirmed by the Guiness Book of World Records.
Source: wikipedia.org
Shortest Men
Khagendra Thapa Magar from Nepal stands at only 22 inches (56 cm) tall according to Guinness World Records.
Gul Mohammed – Shortest man ever verified, measuring only 22.4 inches (57 cm), according to Guinness World Records.
Younis Edwan – Shortest man claimant, is said to be 25 inches (64 cm) tall.
He Pingping – Shortest man currently living (mobile) at 74 centimetres (29 in), possibly the shortest man in the People’s Republic of China.
Lin Yu-chih – Shortest man currently living (immobile) at 67.5 centimetres (26.6 in), according to Guinness World Records
Source: wikipedia.org
Shortest Women
Pauline Musters – at 23 inches (58 cm) tall, recognised by the Guinness Book of Records as the shortest woman ever recorded.
Madge Bester – 65 cm in 1998
Lucia Zarate – Smallest woman claimant and the earliest studied example of microcephalic osteodysplastic primordial dwarfism type
Jyoti Amge – 23-and-a-half inches tall, weighing 12 pounds.
Source: wikipedia.org
Tags: conversion table, height, length
Posted in Articles | Comments Off on Human Height Conversion Table
January 28th, 2010
Are you tired of units conversion? …. changing meters to yards, fahrenheits to celsius, meters per seconds to feet per minutes, calculating speed could be a little boring  So, let’s get a break! So, let’s get a break!
We made simple javascript based, pong-like online game (do you remember first, hm … hard to say computer … maybe ‘an electronic game’. It seems to be an ancient game, right?). Rules are simple. Don’t allow the ball to hit the right side wall. It is called PONG PING because … why not? … it resembles a table tennis called PING PONG and the name seems to us … hm, … funny? Never mind, enjoy

PS. Don’t worry, we’ll get back to units of measurment soon
Posted in Articles | Comments Off on Game Online PONG PING
|